Evaluation Methods
Our eye tracking software allows - beside the posibility of live broadcasting - a variety of evaluation methods
Heatmaps and gaze plots are suitable for a visual overview. For accurate statistics an area of interest analysis is recommended.
Hot spot analysis
Hot spots describe how much visual attention specific screen areas get. Our eye tracking software visualizes clearly: Red (color gradient to yellow and green) areas are viewed more often than others.
The analysis shows the hot spot sum of 20 probands: The main navigation on the left screen part receives the most attention. Users are expecting a navigation on this position.

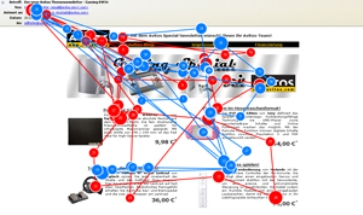
Gaze plot
The gaze plot shows the order of fixations and can determine, which site elements leap to the eye first.
The picture visualizes a gaze plot of 3 probands looking at the subject in the first 3 seconds. The lines show the path of the eyes. A smaller or bigger circle symbolises the length of a fixation.
Different colors indicate the gaze plots of the different probands. The number of fixations (per unit of time) provide insight to the intensity of processing the different subjects.

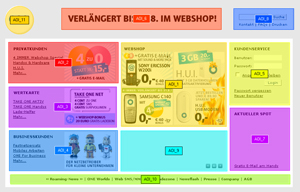
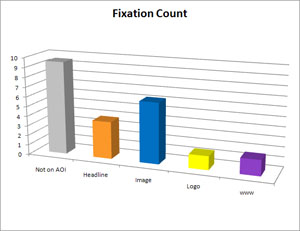
Areas of interest
With an Area of interest (AOI) analysis different reagions of a picture or a website can be compared with each other.
Interessing Areas get marked and evaluated:
Eye tracking helps to design and position content areas perfectly.
Eye tracking evaluations can help us to find out:
- How do elements need to be positiond to be seen?
- Why are some areas viewed intensivly while others are not seen at all?
- Which graphical elements help to gain attention?
We're here for you!
- Contact form
- office[at]usability.at
- +43 1 280 60 17
Our Customers